Smart phones are increasingly more present within the UK and greatly influence consumer habits.
To what extent are the smart phones impacting on the lives of its users? A report published in 2014 by Deloitte named UK Mobile Consumer Survey gives us some key insights into this query.
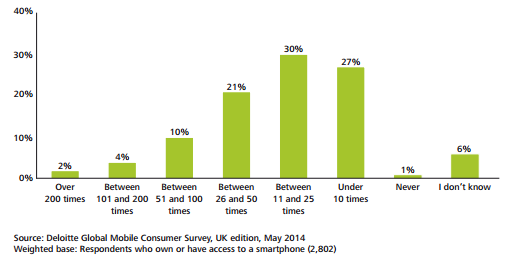
Keeping informed, entertained and in touch with family and friends is becoming more and more seamless thanks to the ever increasing popularity of mobiles and handheld devices worldwide. Within the UK two thirds of people (35 million people) now own a smart phone. For the majority of UK mobile users it is the first thing they check in the morning and the last thing before they turn in for the night. One of the main reasons for the increase in mobile activity is thanks to the fact that we can now perform tasks on them that were previously only possible on computers. For example, 2014 saw a sharp rise in consumers checking their bank balances with 40% signing in with a smart phone, 10% more than the previous year. Smartphones are constantly facilitating our daily lives thus leading to this ‘addictive’ attachment. The table shown here below illustrates this.
Figure 1. Frequency of looking at a smartphone on a daily basis

On average 18-24 year olds check their phones 53 times a day with a steady decrease in ‘looking’ correlating with age. The 35-44 age group check their phones 34 times a day while the 65-75s only reach for their phones a mere 13 times in a day.
Mobile Instant Messaging Vs SMS
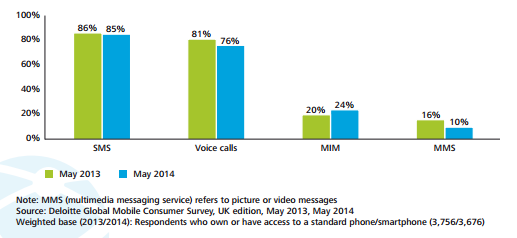
Within the last year instant messaging has really come to the fore within the UK. The service is seen as a cheap alternative to the standard SMS that has dominated the messaging market for years. However, MIM’s are still some way from displacing SMS in the UK, unlike in the South American market where WhatsApp (one of the most popular MIMs) is installed on 90% of all smart phones. Within the UK, only 25% of mobile users use any form of MIM. Although there may be a small amount of users it is thought that they send 55 MIMs a day compared to 8 SMS sent in the same time period. This accumulates to an estimated 300 billion MIMs to be sent in 2014. SMS’ sent on the other hand are expected to fall to 140 billion, 5 billion less than in 2013. Figure 2 demonstrates the changes in popularity within the last year of all mainstream means of mobile communication.
Figure 2. Weekly use of different forms of communication (May 2013 and May 2014)

From the respondents asked within Deloitte’s report, 45% of 18-24 year olds had used MIM within the last week, 27% for the 35-45s (who also boast the highest SMS’ sent: 89%, 2% higher than the youngest demographic) and a low 7% for the 65-75 age section.
There are several reasons why MIM’s have failed to take off within the UK but the main two reasons are the lack of a reliable internet connectivity and the fragmentation of MIM applications. SMS is the only service that works in the absence of data connectivity and thus 91% of MIM users also send SMS’s. There are also several MIM’s such as WhatsApp, Viber, WeChat etc, this variety leads to fragmentation in users which means the consumers are not able to communicate to all their friends on a single platform. For these reasons SMS seems to be here to stay for the near future but MIM’s will force a change in the long term for mobile operators. As consumers become more acquainted with apps for communicating, mobile operators will have to find a way to subsidise the loss of SMS revenue.
How can MIM’s be increasing in popularity if all UK mobile operators offer free SMS packages? Amazingly, 44% of consumers use MIM more frequently because “it is cheaper than SMS” and the same amount stated that they use MIM often because they “can use it on WiFi”. This perceived extra cost for SMS may be due to the fact that consumers have to pay a fixed fee, whereas MIM data usage is all deducted from ones data allowance without a clear idea of how much data has been used.
4G
4G has been within the UK for nearly 2 years and expects to surpass 10 million subscribers by the end of the year, triple that of the previous year. 4G enables for faster data connection but varies in speed from country to country. Within the UK, 4G’s connectivity speed is roughly 15 Mbit/s-20Mbits/s downstream, significantly faster than 3G.
This new connectivity was meant to revolutionise how consumers use their smart phones giving them more freedom and quicker access to the internet. It was expected that watching videos would be the most popular activity for consumers with this increased speed but it has failed to be, most probably due to consumer fear of going over their data connectivity packages. It is still difficult to know and understand how much data is used during these activities. However, 4G has seen a sharp rise in consumers ‘browsing shopping sites’ and ‘searching for information’ on their mobile phones, not only that but there has been an increase in consumer interaction and purchases form smart phones.
This would lead us to believe that 4G hasn’t revolutionised consumer behaviour in the UK but merely enhanced the existing services available to consumers.
Apps
The apps market is seen as one of the most lucrative markets to be involved with (especially within the UK) due to the amount of time consumers spend on their smartphones and their disposal income. However the market is maturing and there appears to be a decline in app downloads. In 2013 an average of 2.4 apps were downloaded per month, in contrast an average of 1.8 have been downloaded in 2014.
Market maturity suggests that consumers already have the apps they need, thus demand for new ones are diminishing. This trend is likely to lead to an increase in advertising to compensate, with advertising currently only contributing a mere 7% to revenue streams.
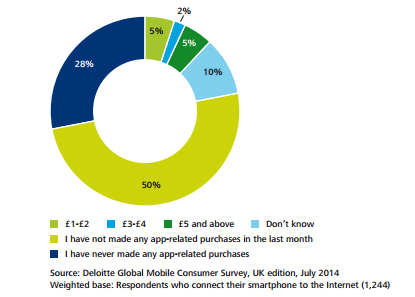
The UK is ranked 4th and 5th in the 1Q of 2014 for countries contributing to app-related purchases within Apple’s and android’s app store respectively, this is a significant share of the global market. That being said a meagre 12% pay for apps, app subscription or in app purchases with the average monthly spend reaching £1.20 per smart phone user, (discounting those who have never made a purchase) see figure 3.
Figure 3. Smart Phone user’s monthly app-related expenditure
More than a third of UK consumers play games weekly, the ‘games’ category is also the highest grossing with it generating over three quarters of app store revenues. Of the third who play games weekly only 9% will actually part with their money, mostly on in app purchases like extra lives and such. The 18-24 year old demographic is the most likely to splash the cash on their apps.
For developers, games and content makers the maturity of the market should ring alarm bells as the size and profitability of the UK mobile market is at the very least changing if not diminishing. This will force alternate ways to bring in additional revenue with advertising the most obvious option at this moment in time.


